
At the Car Wash: How Attributable Effects and Graphical Modeling Clear Up Customer Satisfaction
Sometimes a car wash is more than just a car wash. And sometimes, customer satisfaction isn’t quite as cut and dry either. Forgive the pun, but it’s true. Many companies conduct surveys to assess overall customer satisfaction and how specific attributes such as convenience, location and fast service may drive that level of satisfaction. Yet they stop there. All useful information, but what if you could take your analysis further? What if you could identify which drivers offer the most opportunity and/or the most risk? And what if you could get a clear view how the relationships between these drivers can help you improve purchase intent?
With Attributable Effects analysis and Graphical Modeling you can. See how our fictional car wash did it, and why you should too.
Understanding Attributable Effects and Graphical Modeling in Customer Satisfaction
What is Attributable Effects Analysis?
It’s a probability-based analytical tool that partitions the impact of each possible customer satisfaction driver (or attribute) into two components: maintenance and potential. The goal is to identify areas of greatest opportunity (expressed as Potential), and areas of greatest risk (expressed as Loss).
“Potential” is the percentage of dissatisfied customers that would become satisfied if perceptions on that attribute were improved. Potential is largest when current performance of that attribute is low and it is closely related to satisfaction.
“Loss” is the percentage of satisfied customers that would become dissatisfied if perceptions on that attribute declined. Loss is largest when current performance is strong and it is closely tied to satisfaction.
The Value of Attributable Effects in Customer Satisfaction
Let’s take a look at an Attributable Effects analysis for our car wash.
Attributable Effects
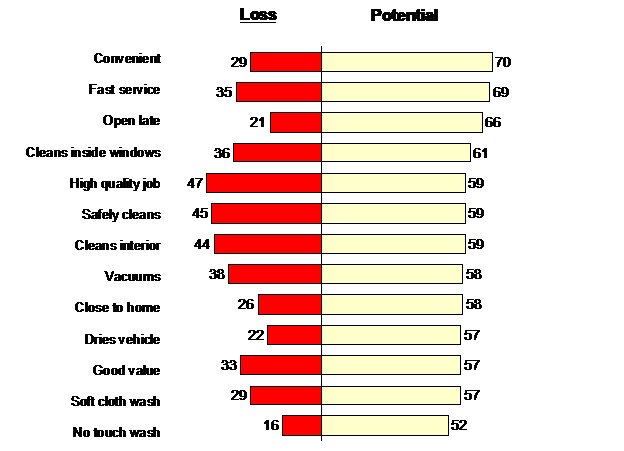
You can see that promoting “convenience” offers greater opportunity for solidifying current customers who are less than completely satisfied. On the other hand, quality and safety perceptions must be maintained in order to keep currently satisfied customers content. Thus, the value of Attributable Effects analysis is that it can identify specific areas that need attention in order to increase the satisfaction of customers.
Get the Full Detail with Graphical Modeling
Graphical Modeling is a quantitative laddering technique that assesses the relationship between attributes and some measure of overall satisfaction. When used in conjunction with Attributable Effects, it provides additional insights into the causality of satisfaction and guidance into improving customer satisfaction or purchasing intent by:
- Focusing on the relationship between the attribute ratings and the overall measure of satisfaction or performance.
- Identifying the few attributes that are most impactful.
Traditional techniques such as multiple regression or correlation provide no understanding about how the attributes interrelate and impact each other while Graphical Modeling utilizes an inductive causality algorithm to understand how these interrelationships may affect the overall satisfaction score.
A Roadmap to Your Highest ROI
In Graphical Modeling, simple correlations are used to uncover the underlying structure of relationships across performance ratings and customer satisfaction. When coupled with Attributable Effects, it provides information on which attributes offer the best improvement opportunities.
The output itself is an easy-to-read “roadmap” that shows how the various attributes connect with each other, and ultimately how they connect with customer satisfaction. In the example below, overall satisfaction is being influenced by two broad categories of perceptions — “quality” (upper half of the graph) and “convenience” (lower half). Attributes that have little to no impact on overall satisfaction are not shown.
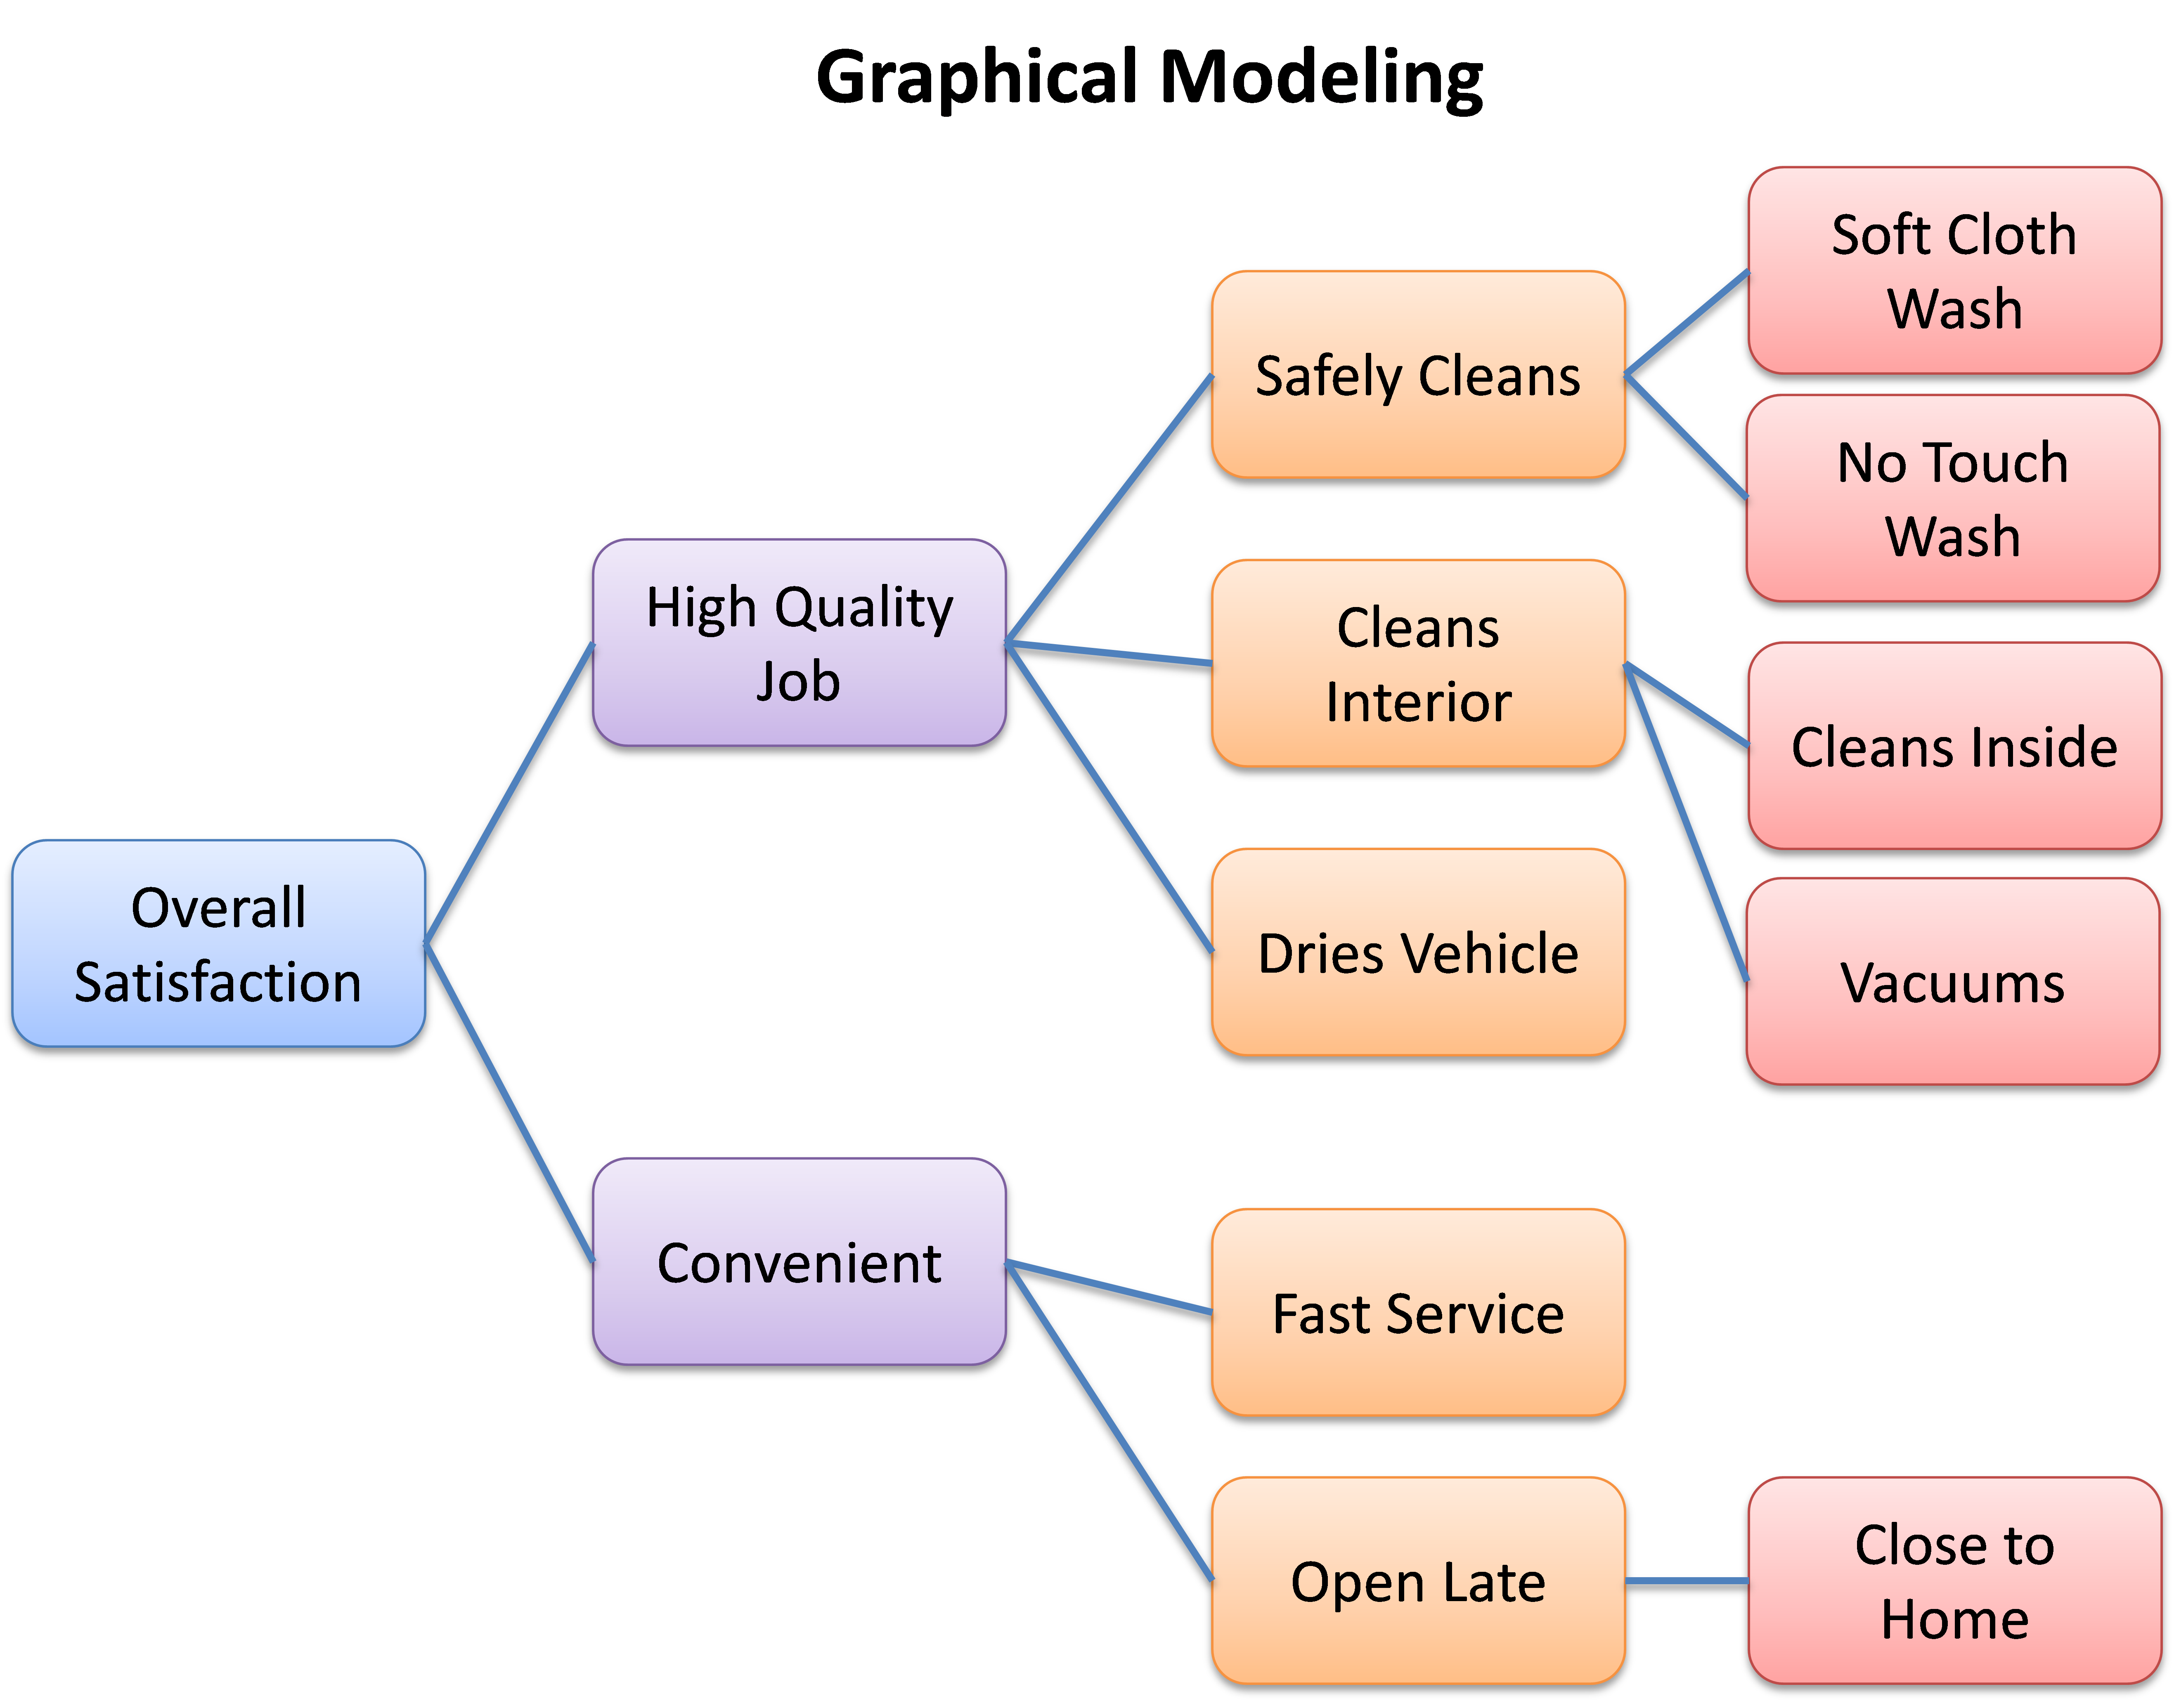
A causal flow is identified by reading from right to left. Attributes at the far right may be considered root causes that impact attributes at the far left, including overall satisfaction. For example, ratings of “convenience” are affected by those of “fast service” and being “open late”, which in turn is affected by “close to home”. By uncovering these interrelationships, the graphical model defines what being “convenient” means to consumers.
We can use Attributable Effects and Graphical Modeling to provide you with a better understanding of the attributes that are driving your customer satisfaction and where your improvement efforts will yield the highest ROI as well.
To learn more, contact Ironwood Insights Group today.