
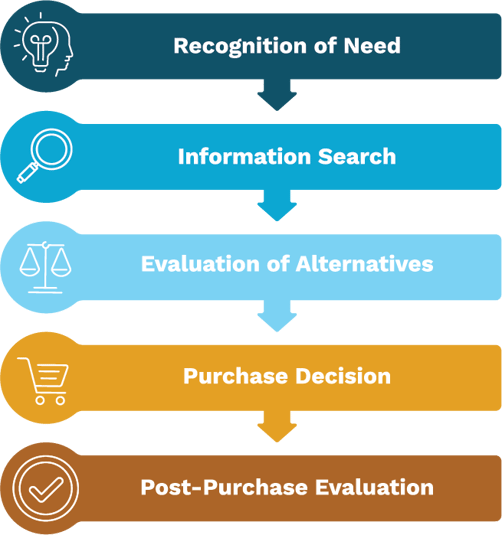
Modern business schools like to teach students the standard Consumer Decision Making Process Model to better understand what goes into a purchase decision. The five steps are shown below. The problem with this model is that it doesn’t explain completely what information different consumers seek, or the thought process that consumers use to evaluate the alternatives.
 Consumers have a hard time articulating the actual thought process that goes into most purchase decisions. As market researchers, we know that it is very difficult to develop questions that accurately capture a consumer’s evaluation of alternatives and the decision-making process before a decision is made. Consumers don’t always make a choice between just two products, goods, or services. Consumers typically evaluate and examine a range of purchase alternatives by examining information on attributes and features such as cost, availability, functionality, prestige, and perhaps even the impact on the environment.
When working with corporate clients, the tendency of the client is to include a large list of attributes when researching the consumer choice process. Corporate clients frequently want to include every possible alternative and scenario when questioning respondents about their choice process. The problem with this practice is that it usually leads to very long questionnaires, respondent burden, reduced incidence, and poor-quality data. With more alternatives, you usually only have two choices: ask more questions, or you can collect less data on each alternative. Luckily, there are choice models that work with large numbers of attributes. We will discuss one such tool here.
Maximum Difference (MaxDiff)
Max-diff analysis, (MaxDiff) can easily handle a large number of attributes. It is a survey research technique for estimating relative preferences, i.e., what do consumers like most, second most, third most, and so on. A MaxDiff study involves presenting a sample of respondents with a series of questions, in which each question contains a list of alternatives, and the respondent is asked which alternative they like the most (best) and which the least (worst). An example is shown below. The list of alternatives changes from question to question. Thinking about choosing a new hospital for your care, which of these attributes is most important to you, and which is least important?
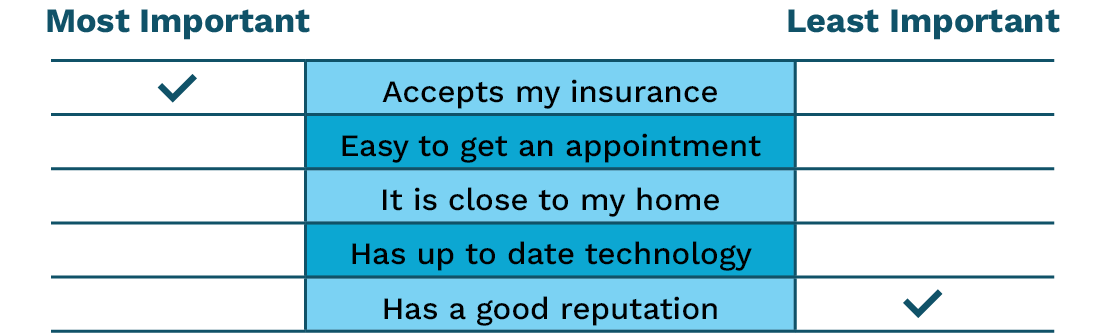
As shown in our example above, consider the problem of working out what features are most important to consumers when selecting a hospital. Asking people to rate the importance of each of the following attributes would not be so useful. Everyone wants to receive the best possible healthcare possible, so hospitals need to know what is most important to consumers. If we just asked consumers to rate each attribute on a scale of 1 to 10, because of the inconsistency of responses from consumers, the results may be difficult to interpret. This is where the use of MaxDiff is ideal.

The end results of a MaxDiff study on the 15 attributes above are:
- A ranking of the attributes in order of preference. In our hospital evaluation case, the goal is to derive the relative importance of each attribute.
- An understanding of the differences between various segments of consumers for the different attributes. Preferences may differ by age or gender, allowing our hospital client to develop marketing campaigns that can focus on the most important attributes with the appropriate consumer segment.
Once the attributes have been identified, it is time to set up the experimental design of the survey. As shown above, respondents are asked to indicate which attribute they prefer most, and which they prefer least. Each question is identical in structure but shows a different list of alternatives. The experimental design specifies which attributes are shown in each question.
If you have 10 or fewer attributes, it is easy to specify an experimental design with just one version of questions. An example is shown in the table below. Each respondent will answer 10 questions.
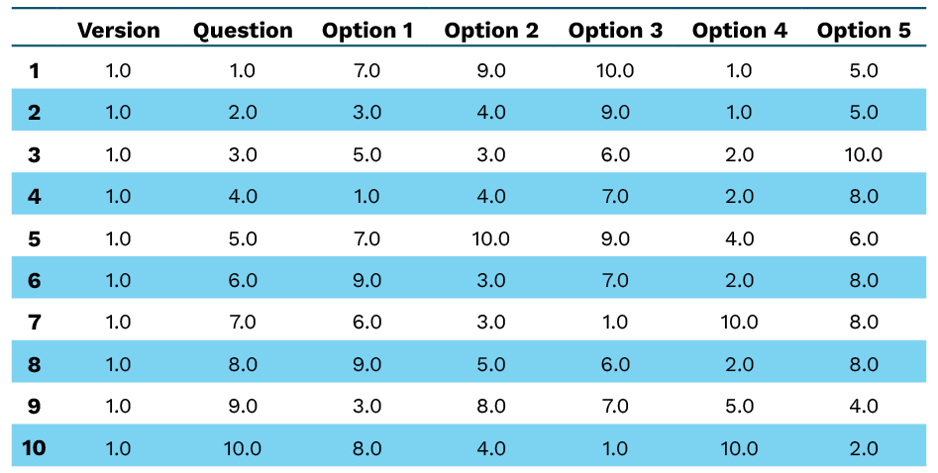
This design ensures that each attribute is presented the same number of times. In the example above, each attribute is evaluated six times. This is called a balanced design.
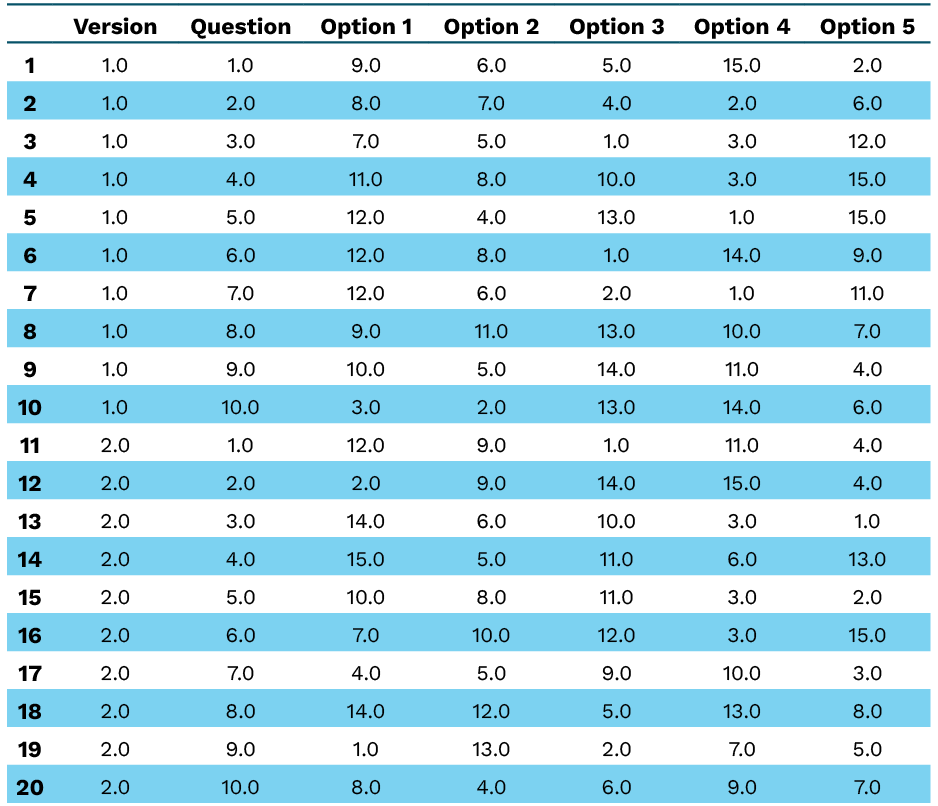
Typically, if you have more than ten attributes, two versions of the question sequence are required, with half of the respondents seeing version 1 and the other half seeing version 2. Below is an example of the experimental design for the 15 attributes specified by our hospital client.
Here again, respondents seeing version 1 will answer 10 questions, and respondents seeing version 2 will also answer 10 questions. A quick review of this table shows that the various attributes are seen a different number of times in version 1 than in version 2.
Analyzing the Data
The easiest way to analyze the data is to just count up the number of times each attribute is scored as “Most Important” and the number of times each attribute is scored as “Least Important.” The problem with this type of analysis is that it doesn’t take into account differences among the different segments of respondents.
Two widespread techniques market researchers use to estimate the priority (or utility) coefficients from MaxDiff are hierarchical Bayes and latent class analysis. Both techniques do a great job of estimating:
- Utility coefficients at the respondent level.
This allows you to compute utility coefficients across various segments of consumers. - Average utility coefficients across all respondents or segments.
- Preference shares at the respondent level.
- Average preference shares.
- Transformation of utility coefficients or shares.
At the respondent or average level, the shares can be transformed so that the “least important” attribute receives a score of 0 while the “most important” attribute receives a score of 100.
The specifics of the computational algorithms of hierarchical Bayes or latent class analysis are beyond the scope of this article. Next time you have a large number of attributes to evaluate and prioritize, consider MaxDiff.
In a time crunch? You can download this information in our handy PDF!


To learn how our research design, data collection, and reporting expertise can help with your qualitative research needs, contact Ironwood Insights Group today.